 Exciting news! In a few weeks, we are heading down to Naples, Florida, where we just launched a new office! Everybody knows...
Read More
 Avert your eyes! My Sunday morning look at incompetency, corruption and policy failures: • How Walmart’s Financial Services Became a...
Read More
 The weekend is here! Pour yourself a mug of coffee, grab a seat outside, and get ready for our longer-form weekend reads: • Why...
Read More
This week, we speak with Sarah Kirshbaum Levy, chief executive officer of Betterment, an independent digital investment...
Read More
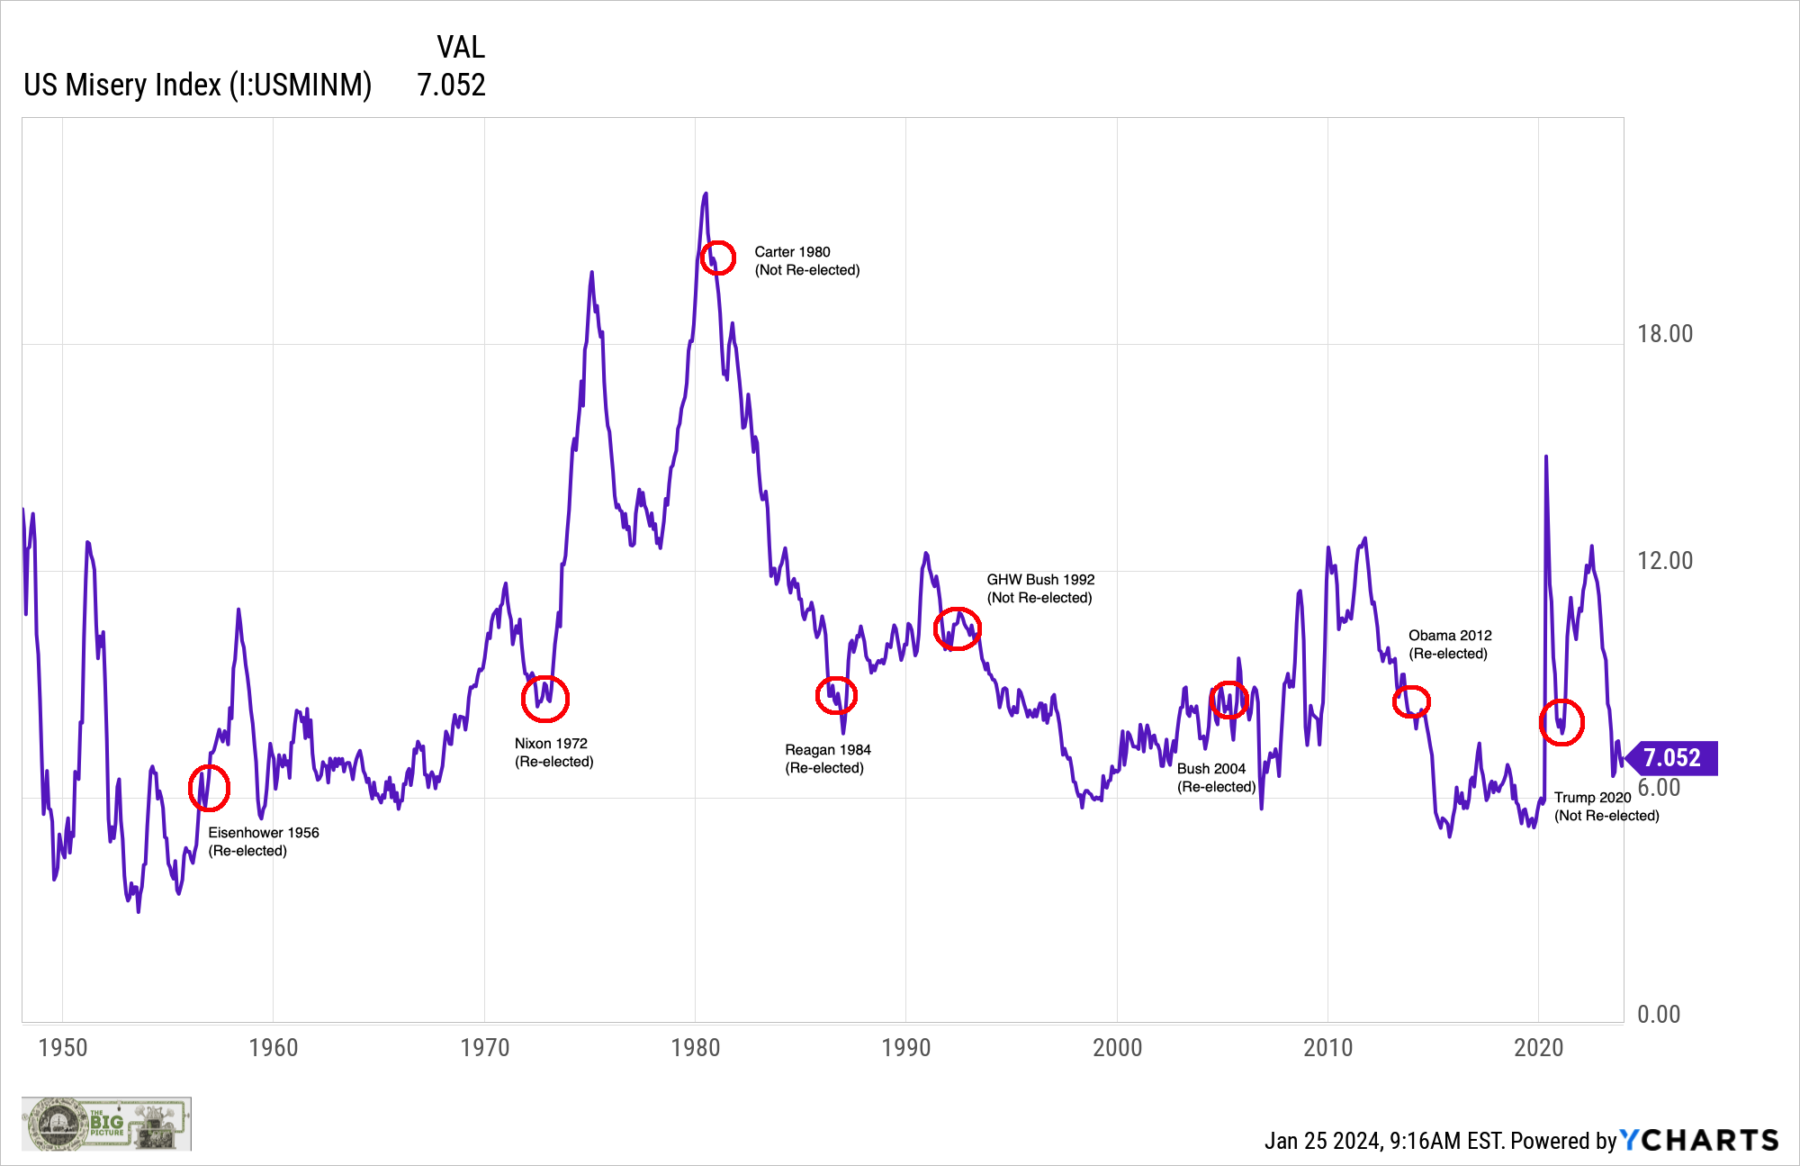 The endless media Sturm und drang over the 2024 election silly season has led me to share a few thoughts and a chart. I...
Read More
At the Money: How to Pay Less Capital Gains Taxes (January 24, 2024) We’re coming up on tax season, after a banner...
Read More
The transcript from this week’s, MiB: Shomik Dutta, Overture Ventures, is below. You can stream and download our...
Read More
 Remember Squid Game? Written and directed by Hwang Dong-hyuk, “Squid Game” made its debut on Netflix on September 17, 2001. It...
Read More
 In May of 2022, I put a deposit down with Moment Motors to convert an ICE car into an EV. The down payment put me into a queue...
Read More
 Avert your eyes! My Sunday morning look at incompetency, corruption and policy failures: • Inside the Crime Rings Trafficking Sand:...
Read More
